
Pipeline – Pipelines using Kubeflow for Custom Models
Follow these steps to analyze the status of the pipeline job, artifacts, lineage and output:
Step 1: Pipeline of custom model
Open the link as shown in Figure 7.10 to navigate to the pipelines of Vertex AI. The pipeline will start executing and will take about 5 to 10 mins. All the four tasks in the exercise will be executed sequentially. Once the complete pipeline is executed, you will see green color tick mark on all the components as shown in Figure 7.11:
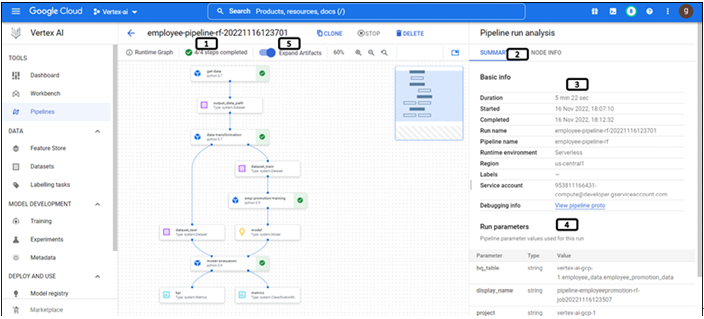
Figure 7.11: Pipeline created & executed successfully
- Indicating all the steps in the pipelines are executed successfully.
- Click SUMMARY section of the pipeline
- Basic info provides the information of pipeline run, region, link to view the logs, and so on.
- Run parameters provides information regarding the parameters that are used for the pipeline. Scroll down to get the run metrics in the summary section.
- Click the toggle button to expand the artifacts
Step 2: Expand artifacts
Artifacts will be expanded in the pipeline as shown in Figure 7.12:
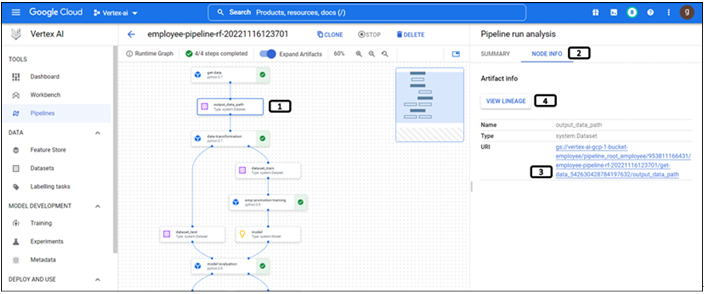
Figure 7.12: Components and artifacts of the pipeline
- Boxes with a tick on it indicates the components of the pipeline. Others are the artifacts of the pipeline. Click on it.
- Click NODE INFO.
- Location of the cloud storage where the artifacts are stored.
- Click VIEW LINEAGE.
Step 3: Lineage of the pipeline
The artifacts and parameters of a pipeline run are recorded in Vertex ML Metadata when you use Vertex AI Pipelines to execute the pipeline. By relieving users from the burden of maintaining pipeline’s information, Vertex ML Metadata facilitates analysis of the items’ provenance. Everything that went into making an artifact, as well as any derivative objects or information, are all part of its lineage.
Lineage for the pipeline will open in a separate tab as shown in Figure 7.13:
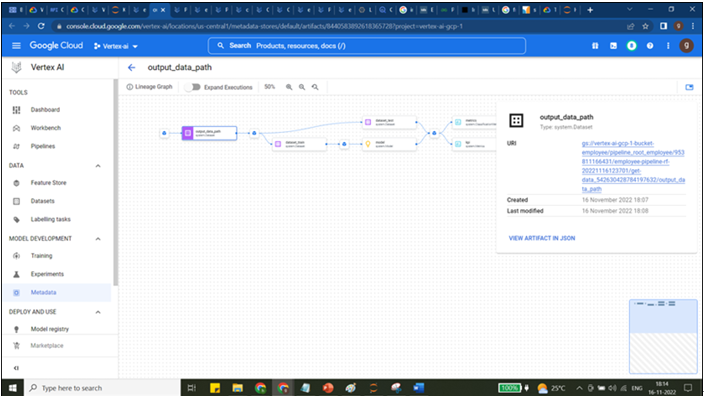
Figure 7.13: Lineage of the pipeline
Step 4: Metrices and KPIs recorded in the pipeline
Metrices of trained model will be available in the artifacts as shown in Figure 7.14:
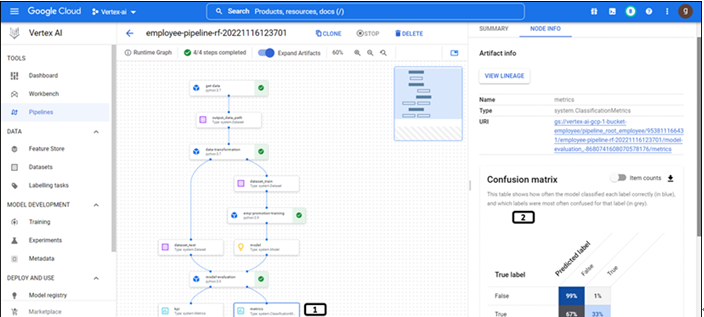
Figure 7.14: Metrics of the model
- Click on the metrices artifacts of the pipeline.
- In the last component of the pipeline, we have recorded Confusion matrix and ROC curve (scroll down to see it) are displayed.
KPIs of trained model will be available in the artifacts as shown in Figure 7.15:
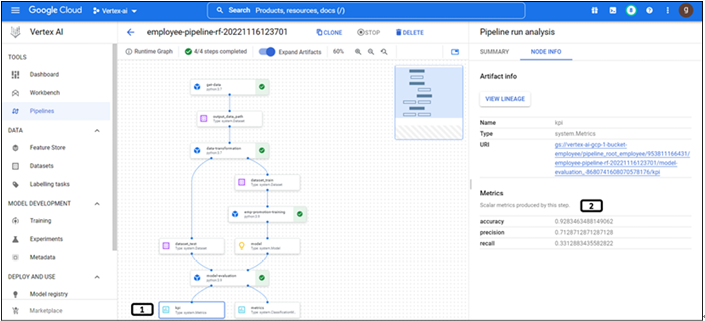
Figure 7.15: KPIs of the model
- Click the kpi artifacts of the pipeline.
- In the last component of the pipeline, we have recorded accuracy and other KPIs of the model which are displayed.
Step 5: Pipeline artifacts stored in cloud storage
Pipeline artifacts are stored in the cloud storage as shown in the following figure. Separate folders are created for the artifacts from different components of the pipeline:
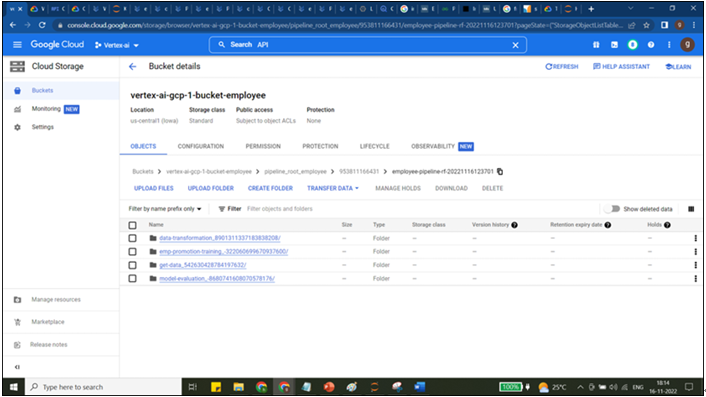
Figure 7.16: Artifacts stored in the cloud storage
You may also like
Archives
- September 2024
- August 2024
- July 2024
- June 2024
- May 2024
- April 2024
- March 2024
- February 2024
- January 2024
- December 2023
- November 2023
- September 2023
- August 2023
- June 2023
- May 2023
- April 2023
- February 2023
- January 2023
- November 2022
- October 2022
- September 2022
- August 2022
- June 2022
- April 2022
- March 2022
- February 2022
- January 2022
- December 2021
- November 2021
- October 2021
Calendar
| M | T | W | T | F | S | S |
|---|---|---|---|---|---|---|
| 1 | 2 | |||||
| 3 | 4 | 5 | 6 | 7 | 8 | 9 |
| 10 | 11 | 12 | 13 | 14 | 15 | 16 |
| 17 | 18 | 19 | 20 | 21 | 22 | 23 |
| 24 | 25 | 26 | 27 | 28 | ||

Leave a Reply